Why Rule-Based AML Systems Fail (and What to Build Instead)
Every few months someone asks me some version of the same question: “our transaction monitoring generates thousands of alerts and almost all of them are false. Should we add machine learning?” The honest answer is: probably, but not the way the vendor demo shows it. This post is the explanation I keep giving, written down: why rules fail structurally rather than accidentally, what ML genuinely changes, and the order in which to introduce it without alarming your regulator.
What a rules engine actually is
Strip away the vendor UI and a transaction monitoring system is a scheduler that evaluates a few hundred boolean expressions against transaction data. Compliance teams call the expressions scenarios or typologies. A representative sample looks like this:
scenario: CASH_STRUCTURING_01
  trigger:   sum(cash_deposits, window=7d) > 30,000
             AND max(single_deposit, window=7d) < 10,000
  segment:   retail
  action:    alert

scenario: HIGH_RISK_CORRIDOR_02
  trigger:   count(intl_transfers, window=30d) >= 5
             AND any(counterparty_country IN high_risk_list)
  segment:   all
  action:    alert

scenario: RAPID_MOVEMENT_07
  trigger:   sum(outflows, window=48h) > 0.8 * sum(inflows, window=48h)
             AND account_age < 90d
  action:    alert
This design is not stupid. Rules are deterministic, cheap to run, trivially explainable, and auditable line by line, which is exactly what regulators asked for when these systems were standardized in the 1990s. The problem is not that rules are dumb. The problem is where the architecture loses information, and those losses are structural. You cannot tune your way out of them.
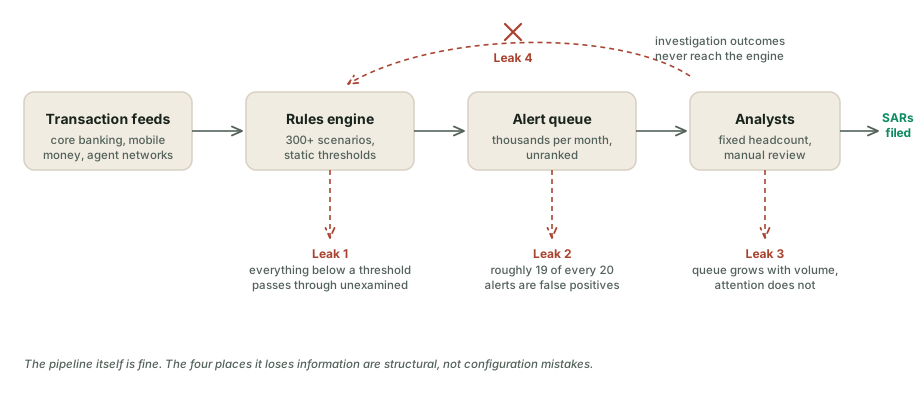
Failure 1: thresholds are public knowledge in practice
A threshold is a line, and lines can be found. Anyone moving money professionally learns your reporting thresholds the same way they learn bank opening hours: by observation, or simply by reading the law, since statutory thresholds like the 10,000 cash reporting line are published. The oldest trick in the book, structuring (or smurfing), is just the act of living beneath the line on purpose.
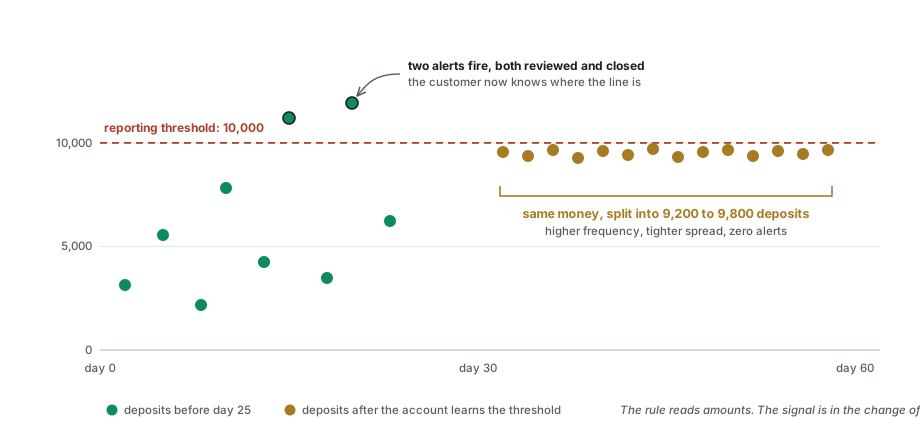
Look at what actually changed in that picture. Total money in stayed the same. What changed is the shape of the behavior: frequency up, variance down, amounts hugging the line from below. A threshold rule reads none of that, because a threshold is a question about a single number, and the evidence is a property of the distribution.
The same blindness cuts the other way and produces the false alerts. A market trader depositing 12,000 in weekend cash sales and a three-week-old account receiving 12,000 from an unknown counterparty cross the same line and generate the same alert. The rule is not measuring suspicion. It is measuring arithmetic.
Failure 2: the alert economics never work, at any threshold
Industry figures for false positive rates in conventional monitoring consistently land above 90 percent, and the systems I have looked at closely fit that picture. People quote the number so often that it has stopped registering, so run the arithmetic instead. A mid-sized institution generating 10,000 alerts a month, at 20 to 30 minutes of analyst time per alert, needs roughly 4,000 analyst-hours a month, which is about 25 full-time investigators, just to touch every alert once. Almost no institution on this continent staffs that. The ones that try burn the team out: when 19 of every 20 cases you open are legitimate customers, attention decays, and the twentieth case gets the same two-minute skim as the rest.
The tuning knobs make this worse, not better. Raise a threshold and you create room under it (see Figure 2). Lower it and the queue explodes. And you are not tuning one knob: a mature program carries 300 or more scenarios whose alert volumes interact, so every change demands months of backtesting while the adversary iterates weekly. Meanwhile the system-level outcome stays dismal. Europol's own analysis put the share of criminal proceeds actually confiscated in the EU at around 1 percent. All this activity, and the pipeline recovers almost nothing.
Failure 3: transactions are the wrong unit of analysis
Laundering that matters is a network activity. Funds fan out from a source through money mules, hop a border, pass through freshly-registered shell companies, and converge somewhere clean. Every individual transfer in the chain is modest, plausible, and below every threshold you have.
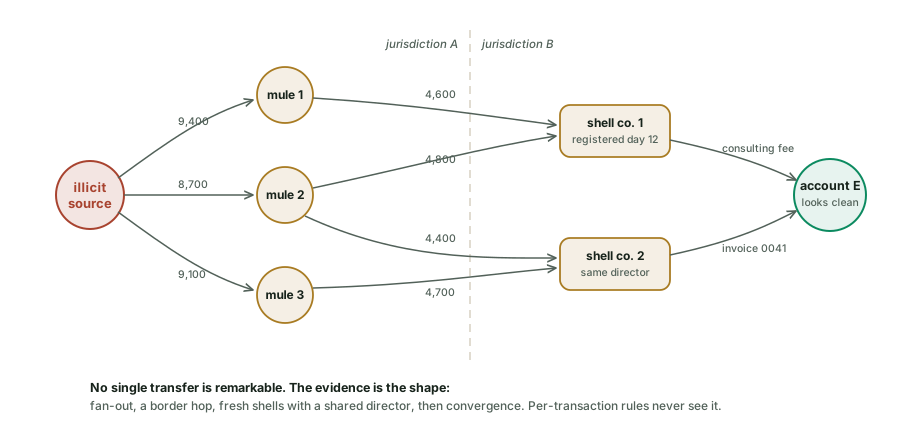
A per-transaction rules engine cannot see this even in principle, because the suspicious object is not any transaction. It is the subgraph. In the mobile-money systems that dominate African retail payments the same structure appears at the agent network level: cash-in through many agents, consolidation through intermediary wallets, cash-out somewhere else entirely. I wrote about the graph-database side of this problem in the context of mapping beneficial ownership with Neo4j; transaction layering is the same shape of problem wearing different clothes.
Failure 4: the system cannot learn, and its data is biased
Analysts close thousands of cases a month and write down, every single time, why the activity was or was not suspicious. In a rules-based stack that knowledge goes into case notes and stays there. The engine that generated a 95 percent false positive rate last month will reproduce it next month, indefinitely, because nothing connects outcomes back to detection.
Here is the subtler part, and it matters enormously the moment you try to fix the learning problem with ML: the labels you do have are biased in a specific, structural way. Analysts only ever review what the rules alerted on. So your labeled data describes life above your thresholds and says nothing at all about life below them, which is exactly where a competent launderer operates. Train a model naively on alert dispositions and it inherits the rules' blind spot with extra confidence.
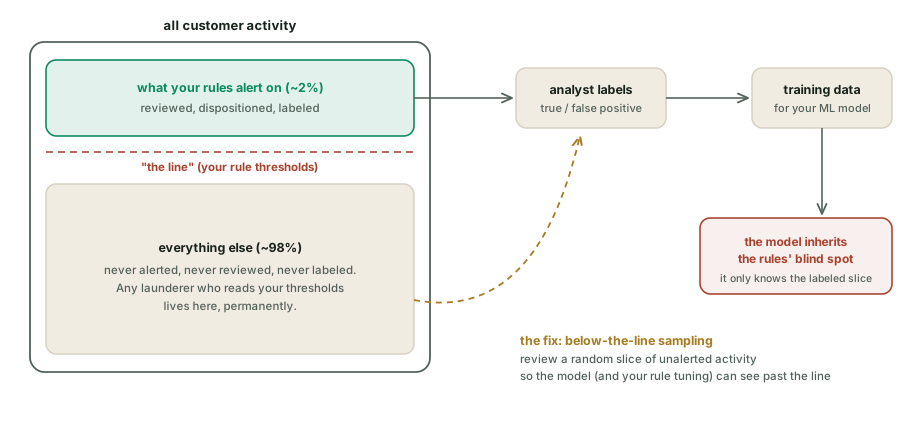
This is why “we trained a model on our historical alerts” is not, by itself, a detection improvement. It is a triage improvement (a real and valuable one, next section), but coverage only improves once you deliberately buy labels below the line through sampling programs.
What ML actually changes, and what it does not
Let me deflate the framing first: machine learning does not “detect money laundering.” No model knows what crime is. What models do is estimate two things well: how similar current behavior is to behavior that previously led to a SAR, and how far current behavior deviates from an entity's own baseline and peer group. Those two estimates, applied in the right order, fix specific leaks from Figure 1. Applied in the wrong order they produce an expensive science project. The right order, in my experience, is triage first, shape features second, network features third.
Step one: triage, not detection
The highest-value, lowest-risk first deployment changes nothing about detection. Keep every rule exactly as it is. Train a gradient-boosted classifier (XGBoost or LightGBM are still the sensible defaults for tabular compliance data) on historical alert dispositions, and use it only to order the queue.
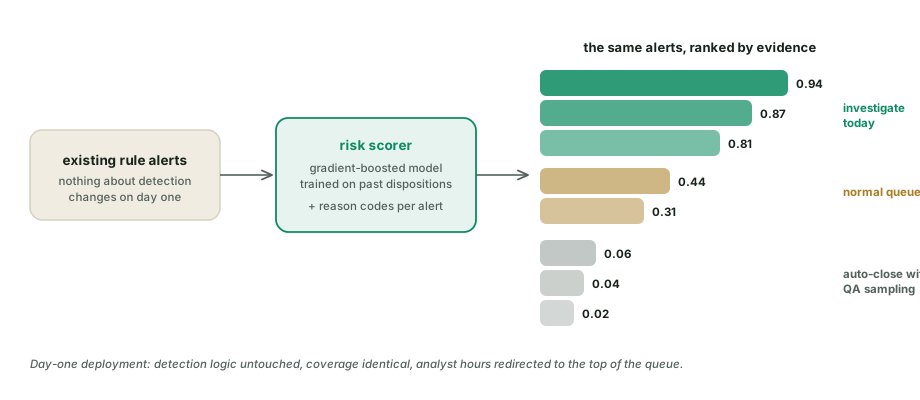
Two disciplines make or break this step. First, evaluate with a time-based split, never a random one: train on months 1 to 12, test on months 13 to 15. Random splits leak future behavior into training and produce beautiful, meaningless numbers. Second, use the metric that matches the operational question. Accuracy is worthless on data that is 98 percent one class. The question a triage model answers is “if my team can work N alerts a month, what fraction of true positives lands in the top N?” That is precision and recall at a fixed alert budget. Backtest it on your own history: what share of alerts that eventually became SARs would have ranked in the top 20 percent of the scored queue? That single number, computed honestly, is the business case.
Step two: features that see shape, not size
The second step does change detection, and the core idea fits in one sentence: encode the behaviors from Figure 2 that thresholds cannot express. You do not need deep learning for this. You need feature engineering that a compliance officer can read:
# Structuring-shape features for entity e over window w
features = {
    # how close do amounts sit under the reporting line?
    "gap_to_threshold_med":  median(T - amt for amt in deposits(e, w)) / T,
    # how many deposits land in the 90-100% band under the line?
    "band_hugging_count":    count(a for a in deposits(e, w)
                                   if 0.90 * T <= a < T),
    # did variance collapse while frequency rose?
    "amount_dispersion":     std(deposits(e, w)) / mean(deposits(e, w)),
    "freq_vs_own_baseline":  count(deposits(e, w)) / count(deposits(e, w_prior)),
    # is this normal for the entity's peer group, not the whole book?
    "amount_vs_peer_p95":    mean(deposits(e, w)) / p95(peer_group(e), w),
    # counterparty and channel shape
    "distinct_agents_used":  n_unique(agent_id(deposits(e, w))),
    "counterparty_churn":    new_counterparties(e, w) / total_counterparties(e, w),
}
The peer-group feature deserves emphasis, especially in African markets. Cash-heavy behavior that looks alarming against a European vendor's calibration is completely ordinary for a Makola market trader, and much of the false positive flood in African deployments comes from imported rule templates calibrated for card-based economies. A model that compares a trader to traders, and a salaried worker to salaried workers, deletes an entire category of false alerts that no global threshold ever could. This is also where unsupervised methods earn their keep: isolation forests and simple reconstruction-error models flag entities whose behavior diverges from their own history and their peers, with no labels required, which is your only detection story for typologies nobody has labeled yet.
Step three: network features before graph neural networks
Everyone wants to skip to graph neural networks. In practice, most of the value of the network view arrives much earlier, with plain graph features computed from a transaction graph: fan-in and fan-out ratios, velocity of pass-through (money in to money out time), shortest path to a previously-confirmed bad account, counterparty overlap with known mule clusters, and shared identifiers (device, SIM, agent, address) across supposedly unrelated accounts. Each of those becomes one more column in the model from step two. When we built AfricaPEP, the relationship graph, not any individual record, was what surfaced connections between politically exposed persons and intermediary entities. Transaction monitoring benefits from the same move: put the graph in the features before you put a GNN in production.
The parts nobody puts in the demo
Labels are noisy and scarce. A “false positive” disposition means an analyst found insufficient evidence within their scope, not that the customer was clean. True positives are often under 2 percent of alerts, and confirmed convictions arrive years late. Use SAR filings as your positive class, weight classes rather than fabricating synthetic positives, and treat label quality as an ongoing engineering concern, not a preprocessing step you do once.
Every score needs a reason. No regulator accepts “the model said so,” and neither should your analysts. SHAP values turn a score into a narrative: this alert scored 0.87 because international transfer velocity is four times the six-month baseline, 70 percent of transfers went to high-risk corridors, and the receiving counterparty is 12 days old. Attach those reason codes to every alert. Analysts investigate faster with them, and your model validation file writes itself.
Governance is a feature, not overhead. Run every new model as a challenger in shadow mode against the incumbent, compare dispositions on the same alerts, version models and thresholds like code, and keep backtest reports regulators can read. None of this is hostile territory anymore: the US federal agencies said explicitly in their 2018 joint statement that innovative approaches including AI are welcome in BSA/AML programs, and the FATF published guidance on new technologies for AML/CFT in 2021 saying much the same. What regulators punish is not models. It is surprises.
Data quality will be most of the work. In several African deployments the hard problems are upstream of any model: the same customer existing under three phone numbers, names transliterated four ways across systems (I covered this in entity resolution at scale), and busy mobile-money agents whose aggregated cash-in volume looks exactly like structuring until you model agents as a segment of their own. Budget for this honestly: it is regularly more than half the project.
A migration path your regulator can live with
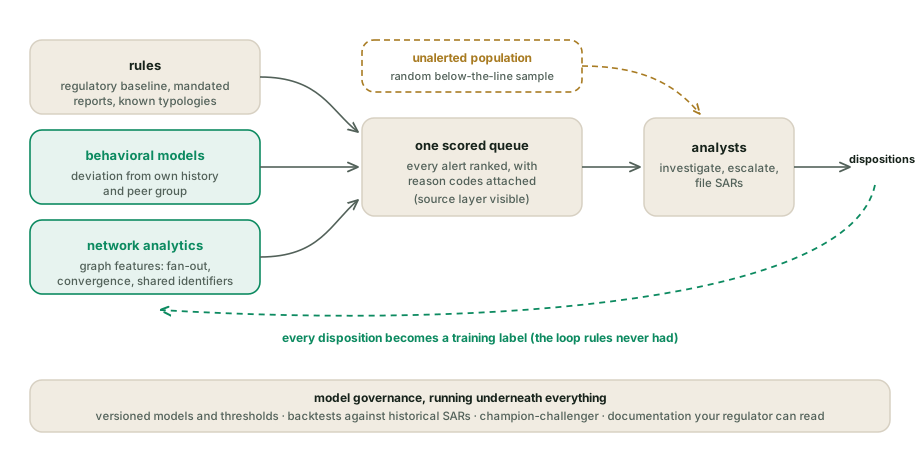
Nobody serious rips out rules and goes pure ML, and regulators would rightly block it if they tried: some rules are legally mandated, and rules remain your coverage backstop. The end state is hybrid, and the path there is incremental, with an evidence artifact at every step:
- Shadow-score history. Train the triage model, score the last 12 months of alerts retrospectively, and produce the backtest: share of eventual SARs in the top of the ranked queue. No production change. The artifact is the backtest report.
- Deploy triage. Rank the live queue. Auto-close only below a deliberately conservative score, with a QA sample of auto-closed alerts reviewed by humans every month. The artifact is the QA sample results showing the floor holds.
- Start below-the-line sampling. Review a random slice of never-alerted activity each month (Figure 4). This is what turns your label set from “what rules see” into “what happens.” The artifact is the sampling methodology and its findings.
- Add challenger detection. Introduce the shape-feature and network-feature models beside the rules, shadow first, then live with their own alerts feeding the same scored queue. The artifact is the champion-challenger comparison.
What this will not fix
- Broken KYC data. A model consuming wrong identities produces confident nonsense. Entity resolution comes first.
- Mandated reports. Statutory thresholds and their filings stay, whatever your model thinks.
- The adversary adapting. Launderers probe models just as they probe thresholds; the difference is that a learning system can respond in weeks instead of quarters. Monitor score distributions for drift, and expect to retrain.
- An under-resourced investigation function. Triage concentrates analyst attention; it cannot replace it.
The honest pitch for ML in AML is narrower than the marketing and much stronger than the skepticism: it reconnects detection to outcomes, reads the shape of behavior instead of its size, and puts your scarcest resource, analyst attention, where the evidence is. For what the investigation layer on top of a scored queue can look like, I wrote a companion piece on building autonomous compliance agents with LangGraph.
Sources and further reading
- UNODC, Money Laundering Overview (the 2 to 5 percent of global GDP estimate)
- UNCTAD, Economic Development in Africa Report 2020 (an estimated 88.6 billion dollars a year leaves Africa in illicit financial flows)
- Europol, From Suspicion to Action (2017) (roughly 1 percent of criminal proceeds confiscated in the EU)
- US federal agencies, Joint Statement on Innovative Efforts to Combat Money Laundering (2018)
- FATF, Opportunities and Challenges of New Technologies for AML/CFT (2021)